MATERIALS AND METHODS
Patients and samples
In this study, we collected a total of 150 primary tumor tissues and corresponding blood samples from patients attending King George’s Medical University in Lucknow between 2010 and 2016. The tissue samples were obtained either during investigative biopsies or during surgical resections of the lesions. Written informed consent was obtained from all patients, in accordance with Institutional Review Board guidelines. One portion of each biopsy was used for routine histopathological examination, while the remainder was snap-frozen and stored in liquid nitrogen. Peripheral blood lymphocytes from the patients were preserved at -80°C until DNA extraction to assess the normal genotype of the loci of interest. Histopathological diagnoses were made according to the WHO criteria. The clinicopathological staging was determined using the UICC TNM staging system, version 6. Patients received standard treatment based on their tumor stage and individual clinical status (see Table 1 for clinicopathological data).
Table 1. Clinico-pathological correlation in OSCC patients treated with cisplatin and capecitabine
| T1 | T2 | T3 | T4a | N0 | N1 | N2 | N3 | Male | Female | |
|---|---|---|---|---|---|---|---|---|---|---|
| Tongue | 0 | 9/2 (22.22%) | 30/16 (53.33%) | 17/12 (70.58%) | 0 | 13/6 (46.15%) | 41/24 (58.53%) | 5/1 (20%) | 54/28 (51.85%) | 5/3 (60%) |
| Buccal mucosa | 7/2 (28.57%) | 5/1 (20.00%) | 23/14 (60.86% | 3/1 (33.3) | 2/1 (50%) | 19/6 (31.57% | 24/15 (62.5%) | 2/1 (50%) | 37/19 (51.35%) | 9/4 (40%) |
| Lip | 0 | 13/5 (38.46) | 6/0 (0) | 0 | 3/0 (%) | 13/3 (23.07% | 2/2 (100%) | 1 (0%) | 19/5 (26.31% | 0 |
| floor of mouth | 0 | 3 | 3 | 2/2 (100%) | 0/0 | 4 (0) | 4/2 (50%) | 0 (0) | 7/2 (28.57%) | 1 (0) |
| alveolus | 1 (0) | 2 (0) | 6/2 (33.33%) | 1 (0) | 4/1 (25% | 5/1 (20%) | 1(0%) | 0 (0%) | 9/2 (22.22%) | 2 (0) |
| Hard palate | 1 (0) | 1 (0) | 4/2 (50.00) | 1 (0) | 1/1 (100%) | 2/0 (0%) | 4/1(25%) | 0 (00%) | 6/2 (33.3%) | 1 (0) |
| Av death per (%) | 22.22% | 25 | 49.27% | 62.5 | 30% | 28.57 | 57.89% | 25% | 43.93% | 41.17% |
Treatment
Surgery, post-operative radiation, and chemoradiation were used based on the disease stage and high-risk features. Locoregional external beam radiotherapy with cobalt-60 was delivered at 2 Gy per fraction tailored to the tumor and neck nodes. Patients who did not undergo surgery received 70 Gy in 35 fractions over 7 weeks with concurrent chemotherapy. Those who underwent surgery either had close monitoring or received 60-64 Gy in 30-32 fractions alongside chemotherapy, based on their stage and risk factors. The chemotherapy regimen included cisplatin (75 mg/m2 on days 1 and 2) and capecitabine (750 mg/m2 in two divided doses from days 1 to 14, with pyridoxine at 200 mg on the same days), administered over up to five cycles with a 3-week interval between them.
Treatment involved surgery (S) and chemoradiation (CT) for 16 patients (10.66% of cases), surgery plus radiation (RT) for 12 patients (8%), and a combination of radiation and CT for 119 patients (79.33%). Only surgery was performed in three patients (2%). Out of 31 patients who had surgery, 24 underwent total excision (15 with R0 margins and nine with R1 margins), while seven had subtotal excision. Additionally, five patients with subtotal excision and one without surgical excision were classified as having R2 tumors. Patients were evaluated 4 to 6 weeks post-treatment.
Treatment toxicity and compliance
There were no surgical complications, including postoperative deaths or wound issues. Radiotherapy (RT) toxicity affected 12 patients (80%),[11] resulting in grade 1-2 dermatitis and oral mucositis, with no grade 3 or higher toxicity. Chemotherapy (CT) toxicity occurred in seven patients, presenting with grade 1-2 hematological issues.[12] All patients completed treatment without experiencing significant toxicity or interruptions. Patients were monitored weekly for acute chemoradiation-induced toxicity through medical interviews, physical exams, and complete blood counts, while late radiation toxicity was assessed during follow-ups. Toxicities were graded using the National Cancer Institute Common Toxicity Criteria (NCI-CTC) version 3.0, with hand-foot syndrome graded from 1 to 3.
Follow-up
The duration of symptoms was recorded as the time from the first complaint to diagnosis. Survival, recurrence, and progression data were collected from chart reviews and patient or relative contact. Response evaluations used RECIST criteria for both clinical and radiological assessments.[17]
Preparation of DNA and PCR
DNA was extracted from blood and tumor tissue using a proteinase K digestion and phenol-chloroform method.[13,14] Eighteen microsatellite markers on chromosome arm 11q13, including TPCN2, MYEOV, CCND1, and FGF4,[13] were used in this study (see Table 2 for primer sequences and product sizes). The genetic map locations and primer sequences were obtained from the NCBl’s UniSTS site (www.ncbi.nlm.nih.gov/ genome/sts/) and relevant research articles. The microsatellite primers were purchased from Bangalore Genie.
Table 2. Oligonucleotide sequences used as microsatellite markers at Chr.11q13
| SL. no | Gene/primer Name 11q13 gene region | Type | Primer sequence | Product size (bp) |
|---|---|---|---|---|
| 1 | TPCN2 | F | 5′-CAGTTGTTTTCTCTTGTTGCTG | 75–210 |
| R | 5′-TCCCTTGTCCTCTGACTTGTTT | |||
| 2 | MYEOV | F | 5′-CACTTCCCTGACCCCAGTAA | 124–308 |
| R | 5′-ATGAGCAACGAGTCCCTGTC | |||
| 3 | CCND1 | F | 5′-GAGGTGGCAAGAGTGTGGAG | 150–525 |
| R | 5′-CCTGGAAGTCAACGGTAGCA | |||
| 4 | ORAOV1 | F | 5′-AAGTAGGGTCATCATAAGGGAAT | 150–378 |
| R | 5′-AGGAAGCCAGCAGCATAGC | |||
| 5 | FGF4 | F | 5′-ATGCTCCACGCCATACTACA | 77–244 |
| R | 5′-GTGTGCTGCTATTCTGTGTTTT | |||
| 6 | TMEM16A | F | 5′-CAGCATTTCCAACCCACAG | 136–302 |
| R | 5′-GCACTCCAGACAGCCAGATA | |||
| 7 | FADD | F | 5′-AGCCATTCAGTCACCAATCA | 98–256 |
| R | 5′-GCTGTTCTGTCCATCCTGTC | |||
| 8 | PPFIA1 | F | 5′-TGCTTTGGAAGATAAGGTAAGTT | 120–206 |
| R | 5′-TGGCAGAGGGTGGGAAA | |||
| 9 | CTTN | F | 5′-TTCCTCATTGGATTACTGTGTTT | 73–182 |
| R | 5′-TACCTTTCTTTCCGCTTGGA | |||
| 10 | SHANK2 | F | 5′-GCGTGCATCCAAGAAATGCG | 58–140 |
| R | 5′-AGGTTCAGTAGACTCGAATGG | |||
| 11 | DHCR7 | F | 5′-GCGGAGGTAGGTCTTTCACA | 106–180 |
| R | 5′-CCATTTCGCCATAGAACCAT | |||
| 12 | Reference | F | 5′-TGGGCAGACACATCGTAGCA | 78 |
| NAGK | R | 5′-CACCTTCACTCCCACCTCAAC | ||
| 13 | FGF3 | F | 5′ATTTCCAGAGCCAGCTCAAA | 198–220 |
| R | 5′CTTTAATGTTGTGATGACACAAAGC | |||
| 14 | INT2 | F | 5′TCTGCCTCCTGGGTTCAAG | 364–379 |
| R | 5′AGGAAAGACAAGGTTGTAGG | |||
| 15 | D11S2179 | F | 5′TAGGCAATACAGCAAGACCCTG | 123–133 |
| R | 5′GCACTGGAATACGATTCTAGCAC | |||
| 16 | D11S901 | F | CCCACATAGATTACTGGCCTC | 210–236 |
| R | ATTCCTACATTAGCAGTTGGCA | |||
| 17 | D11S1887 | F | CTCCTCTGTATTCCCACAAAAC | 156–208 |
| R | ACCTGACATTGTATCTAAACCTC | |||
| 18 | D11S1358 | F | CACAACCTGGATGAACCCTA | 140–200 |
| R | AACCAACATTCTACTTTCTGTCT | |||
| 19 | D11S917 | F | ATGATGCCATATCTTGTCTTGA | 175–228 |
| R | AATTTAAAGACAGATGCCAAGC |
PCR
The microsatellite PCR was performed in a 25-μL reaction containing 50 ng genomic DNA, 15 PMOI of each primer, 1.5 μL of dNTPs, 3.3 μL of 10X assay buffer with MgCl2, and 0.6 μL of Taq polymerase. Amplification used the MJ Research Thermocycler, starting with an initial denaturation at 94°C for 5 min, followed by 35 cycles of 1 min at 94°C, 1 min at 57°C, and 2 min at 72°C, ending with a final extension at 72°C for 7 min. The PCR products were then analyzed using 3% agarose gels.
Sample preparation and DNA fragment analysis
The gels were scanned and analyzed using Fragment Manager software from Pharmacia Biotech. The size marker preparation and assessment of MSI and loss of heterozygosity (LOH) followed previously reported methods. LOH was determined by comparing heterozygous alleles in normal and tumor samples, considering LOH present if the tumor allele was absent or showed a reduction of 50% or more compared to the normal allele. MSI was identified by any additional band in tumor DNA not found in normal DNA. Samples with allelic loss were reanalyzed after a second independent amplification. The LOH determination model is calculated as follows: (height of normal allele two + height of normal allele one)/ (height of tumor allele two + height of tumor allele one). NAGK, a housekeeping gene on chromosome 2, served as a reference for normalization.
Assessment of allelic losses
MSI and LOH were evaluated through PCR amplification of microsatellite markers. MSI was identified by a shift or change in the intensity of a specific allelic band on the autoradiogram, while LOH was characterized by a total loss or a reduction of 50% or more in the signal density of one heterozygous allele. Scoring was initially done by visual inspection followed by quantification using a densitometric scanner (model 300A) with Image Quant (version 3.3). An optical density range of 0.01 to 4.0 OD units was used, with a spatial resolution of 100 points/cm. Relative quantification employed the standard curve method. Copy numbers were calculated as the log2 ratio of each tumor target locus to an internal reference locus (N-acetylglucosamine kinase, NAGK) relative to the reference DNA. A log2 ratio greater than 0.59 was set as the cutoff for copy number
RESULTS
A total of 150 patients diagnosed with OSCC were included in this study. The cohort comprised 132 males (88%) and 18 females (12%), with a mean age of 55.3 years at diagnosis. The age range for females was 38 to 73 years, while for males, it was 42 to 82 years. Although the mean age was slightly lower in females, this difference was not statistically significant. The clinicopathologic data are presented in Tables 1 and 3. The tongue was identified as the most frequently affected site, with 59 cases reported (54 males and five females, representing 39.33% of the total cases). The study documented 31 deaths, which included 28 males (51.85% of total deaths) and three females (60%, which accounts for 52.54% of total deaths). The observed tumor and nodal statuses included T4a with 17 cases, resulting in a mortality rate of 70.58%, and N2 with 41 cases, corresponding to a mortality rate of 58.53%.
Table 3. Clinicopathological characteristics of OSCC patients treated with cisplatin & capecitabine
| Gender | |
|---|---|
| Male | 132 |
| Female | 18 |
| Body weight | |
| Male | 67.34 (43–79) |
| Female | 55.3 (38–73) |
| Body mass index | |
| Male | 25.81 ± 3.02 |
| Female | 23.62 ± 4.03 |
| Hemoglobin | |
| Male | 10.5 ±1.02 |
| Female | 10.1 ±1.5 |
| Habits | |
| Exclusive chewers | 76 |
| Exclusive smokers | 25 |
| Exclusive drinkers | 32 |
| Mix habits | 17 |
| Pathological grade | |
| Well-differentiated | 24% |
| Moderate | 49% |
| differentiated | |
| Poor differentiated | 68% |
| Tumor/nodal location | |
| Tongue | M-54; (EP-2); F-5 |
| Buccal Mucosa | M-37; (EP-5); F-9, (EP-1) |
| Lip | M-19, (EP-1); F-Nil |
| Floor of the mouth | M-7; F-1 |
| Alveolus | M-9(EP-1); F-2 |
| Hard palate | M-6, (EP-1); F-1 |
| Pathological stages | |
| T1 | T-0/0; Bm-7/2, Li-0/0, Alv-1/0, Fm 0/0, Hp-1/0 |
| T2 | T-9/2; Bm-5/1, LI-13/5, Alv-2/0, Fm-3/0, Hp-1/0 |
| T3 | T-30/16, Bm-23/14, Li-6/0, Alv-6/2, Fm-3/0, Hp-4/2 |
| T4 | T-3/1, Bm-9/5, Li-0/0, Alv-0/0, Fm-0/0, Hp-0/0 |
| T4a | T-17/12, Bm-3/1, Li-0/0, Alv-1/0, Fm-2/2, Hp-1/0 |
| Nodal status | |
| N0 | T-0/0, Bm-2/1, Li-3/0, Alv-4/1 |
| N1 | T-13/6, Bm-19/6, Li-13/3, Alv-5/1 |
| N2 | T-41/24, Bm-24/15, Li-2/2, Alv-1/0 |
| N3 | T-5/1, Bm-2/1, Li-1/0, Alv-0/0 |
| Treatment | |
| Surgery only | 5 |
| Surgery + RT | 12 |
| Surgery + RT | 43 |
| + CT | |
| CT + RT | 67 |
| CT | 23 |
| Recurrence status | |
| NO recurrence | 68 |
| Relapse | 58 |
| Lost to follow-up | 14 + Relapse, EP-10 |
| Clinical outcome | |
| Alive without | 37 (24.66%) |
| disease | |
| Dead | 65 (43.33%); M-43.93%; F-41.17% |
| Month-wise mortality | 5/1, 6/4, 7/1, 8/0, 9/6, 10/0, 11/4, 12/6, 13/5, 14/6, 15/3, 16/1, 17/6, 18/17, 19/4, 20/3, 23/1, 24/2, 26/3, 30/1 |
| Alive with disease (month) | 48 (38) |
The buccal mucosa was affected in 47 cases (37 males and 10 females, including one early phase case, accounting for 31.33% of total cases). There were 23 deaths (19 males, 51.35% mortality; four females, 40% mortality), and the tumor and nodal status showed T3 in 23 out of 14 cases (with a mortality rate of 60.86%) and N2 in 24 out of 15 cases (with a mortality rate of 62.5%). The hard palate was affected in seven cases (4.66%), with two deaths (28.57%). The lip was affected in 19 cases (12.66%), resulting in five deaths (26.31%). The floor of the mouth was most frequently affected in men, with seven cases (4.66%) and two deaths (28.57%), while in women, there was only one case (0.66%).
The solid tumor type was observed more frequently in males (72%) compared to females (59%). Conversely, the peripheral tumor type occurred more often in females (28%) than in males (19%), although these differences did not reach statistical significance. This study identified significant associations between tumor status and mortality (P > 0.05); however, no significant differences were found in the relationship between nodal involvement and death. A single unicystic case was documented in a male patient (refer to Table 1). The primary tumors were measured to have an average size of 2.1 cm, with a median size of 1.75 cm and a range spanning from 0.6 cm to 5.0 cm. The unicystic tumor exhibited the largest size, measuring 2.5 cm in diameter, followed by solid and peripheral tumors, which had mean sizes of 2.1 cm and 2.0 cm, respectively. The mean follow-up duration for the patients was 24 months, with a range of 5 to 36 months. Regrettably, all patients had passed away by the time of the last recorded follow-up. Out of the patient cohort, 16 individuals underwent radical surgery (67%), whereas the remaining 33% received conservative surgery. Notably, no significant relationships were identified between the type of surgery and other variables, including gender, histotype, tumor localization, and recurrence. During the follow-up period, 65 patients (43.3%) experienced a recurrence, which included 58 men (43.93%) and seven women (38.88%) (EP-11). All recurrent cases were solid tumors, primarily affecting the tongue and buccal mucosa, with an average survival time of 15 months (ranging from 5 to 30 months). Among the 54 recurrent cases, 28 involved the tongue. The size of the recurrent tumors was significantly larger (P > 0.01).
The study analyzed microsatellite results and the distribution of LOH and MSI in 150 OSCC cases. The overall incidence of LOH/MSI was 60% ± 20.84, with individual marker frequencies ranging from 9% to 95%. LOH was most frequently detected at five loci: FGF4, FGF3, 1NT2, CCND1, and D11S4533, using NAGK as the reference marker. LOH was predominant in tumors of the tongue, buccal mucosa, and lip, affecting three to six loci, while two tumors showed LOH at only one or two loci. MSI was present in all tumors of these locations with at least three affected loci, primarily in male patients, with only 5% observed in females. No significant association was found between LOH and the patients’ age or tumor size, but tumor stage was significantly related to LOH/MSI (P > 0.05). Furthermore, a mixed habit was associated with the presence of LOH [Table 4, Figures 1-3].
Table 4. Analysis of 18 microsatellite markers of CCND1 loci examined in 150 OSCC patients
| SL. no | Locus | Allele No. | HO | He (%) | LOH (%) | MIS (%) |
|---|---|---|---|---|---|---|
| 1 | TPCN2 | 4 | 97.33% | 4.60% | 5.33%/150 | 4.60% |
| 2 | MYEOV | 6 | 97.30% | 6.30% | 18%/150 | 2.60% |
| 3 | CCND1 | 5 | 47% | 31.33% | 88%/150 | 15.13% |
| 4 | ORAOV1 | 5 | 93% | 17.33% | 26%/150 | 9.30% |
| 5 | FGF4 | 2 | 50.66% | 18.66% | 65.33%/150 | 11% |
| 6 | TMEM16A | 1 | 80.66% | 12% | 10.66%/150 | 2.60% |
| 7 | FADD | 6 | 81.33% | 6.66% | 14%/150 | 9.66% |
| 8 | PPFIA1 | 6 | 40% | 16% | 11.33%/150 | 8.66% |
| 9 | CTTN | 4 | 78% | 22% | 9.33%/150 | 7.33% |
| 10 | SHANK2 | 4 | 85.33% | 11.33% | 11%/150 | 6% |
| 11 | DHCR7 | 6 | 93.66% | 18.66% | 13.33%/150 | 9% |
| 12 | Ref.NAGK | 1 | – | – | – | – |
| 13 | FGF3 | 2 | 28% | 51.33% | 77.33%/150 | 13.23% |
| 14 | INT2 | 6 | 23% | 50% | 64%/150 | 12.8% |
| 15 | D11S2179 | 8 | 24% | 49.33% | 61.33%/150 | 12.66% |
| 16 | D11S1358 | 7 | 86% | 19.33% | 16.66%/150 | 4.66% |
| 17 | D11S917 | 4 | 92% | 25.33% | 34.66%/150 | 4% |
| 18 | D11S1887 | 3 | 92.66% | 13% | 18.66%/150 | 2% |
| 19 | D11S901 | 2 | 82.66% | 14% | 22.66%/150 | 2% |
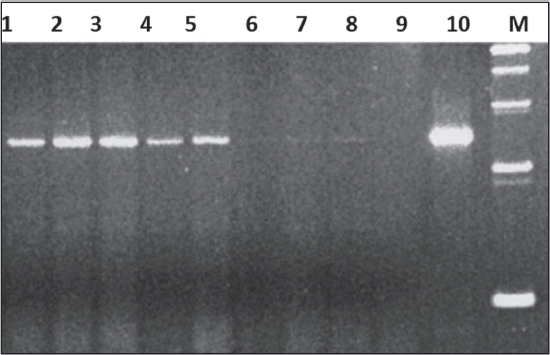
Figure 1. FGF3-microsatellite with mismatch (6-9) & He (10). It is showing LOH & MSI on 220 bp (1 to 10 patients samples, M = marker)
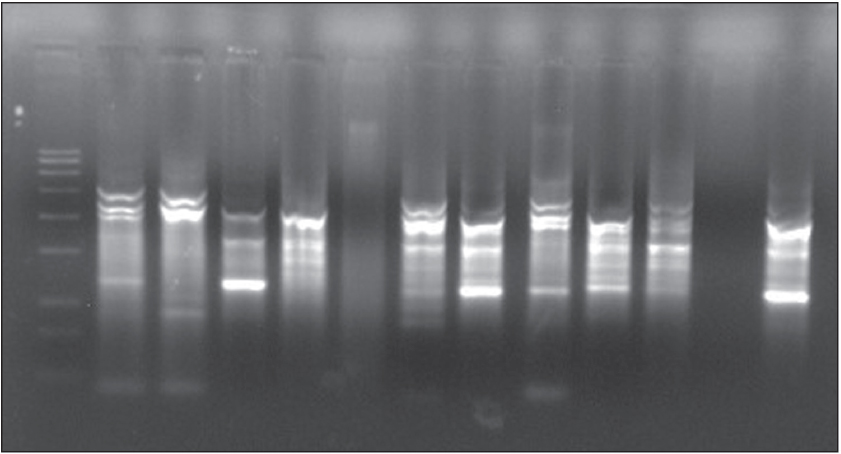
Figure 2. CCNDl-microsatellite with LOH & MSI. It is showing LOH & MSI on 500 bp (1 to 12 patients samples, M = marker)
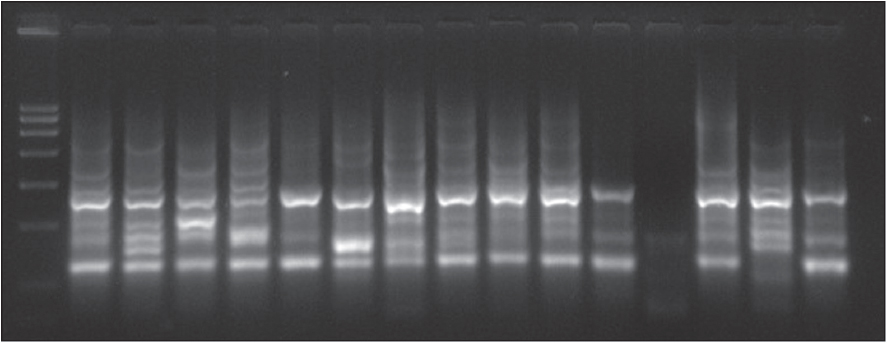
Figure 3. INT2-microsatellite with LOS & MSI. It is showing LOH & MSI on 364 bp (1 to 15 patients samples, M = marker)
DISCUSSION
The progression of carcinogenesis in oral tissues is a complex process involving various morphological and genetic changes, such as the activation of oncogenes and inactivation of tumor-suppressor genes. Tumor cells can exhibit alterations in genes related to their cell cycle. Two main types of microsatellite alterations are observed in human tumors: deletion, leading to LOH, and MS1, initially identified in hereditary non-polyposis colorectal cancers (HNPCC).[18-21] While MSI primarily characterizes HNPCC- related tumors, it can also occur in some sporadic cancers. Discrepancies in reported MSI frequencies may result from different sources of tumor DNA and variations in the microsatellites analyzed. To standardize MSI detection, a panel of mono- and dinucleotide repeats, which are mainly affected by mismatch repair (MMR) deficiencies, was established. Additionally, a newer form of instability, called elevated microsatellite alterations at selected tetranucleotides (EMAST), has been recognized. This instability, not related to MMR deficiency, is observed at tetranucleotide repeats and appears frequently in various human tumors [Tables 5 and 6].
Table 5. Clinico-pathological correlation in OSCC patients treated with cisplatin and capecitabine
| T1 | T2 | T3 | T4 | T4a | N0 | N1 | N2 | N3 | Male | Female | |
|---|---|---|---|---|---|---|---|---|---|---|---|
| Tongue | 0 | 9/2 (22.22%) | 30/16 (53.33%) | 3/1 (33.33%) | 17/12 (70.58%) | 0 | 13/6 (46.15%) | 41/24 (58.53%) | 5/1 (20%) | 54/28 (51.85%) | 5/3 (60%) |
| Buccal mucosa | 7/2 (28.57%) | 5/1 (20.00%) | 23/14 (60.86% | 9/5 (55.55%) | 3/1 (33.3) | 2/1 (50%) | 19/6 (31.57%) | 24/15 (62.5%) | 2/1 (50%) | 37/19 (51.35%) | 9/4 (40%) |
| Lip | 0 | 13/5 (38.46) | 6/0 (0) | 0 | 0 | 3/0 (%) | 13/3 (23.07%) | 2/2 (100%) | 1 (0%) | 19/5 (26.31% | 0 |
| Floor of the mouth | 0 | 3 | 3 | 0 | 2/2 | 0/0 (100%) | 4 (0) | 4/2 (50%) | 0 (0) | 7/2 (28.57%) | 1 (0) |
| Alveolus | 1 (0) | 2 (0) | 6/2 (33.33%) | 0 | 1 (0) | 4/1 (25% | 5/1 (20%) | 1 (0%) | 0 (0%) | 9/2 (22.22%) | 2 (0) |
| Hard palate | 1 (0) | 1 (0) | 4/2 (50.00) | 0 | 1 (0) | 1/1 (100%) | 2/0 (0%) | 4/1 (25%) | 0 (00%) | 6/2 (33.3%) | 1 (0) |
| Av death per (%) | 22.22% | 25 | 49.27% | 50% | 62.5 | 30% | 28.57 | 57.89% | 25% | 43.93% | 41.17% |
Table 6. OSCC patients showing drugs response/chemo response against CCND1 microsatellite LOCI
| SL no | Locus | CR | PR | NR |
|---|---|---|---|---|
| 1 | TPCN2 | 0 | 1 | 0 |
| 2 | MYEOV | 0 | 1 | 0 |
| 3 | CCND1 | 129 (86%) | 18 (12%) | 3 |
| 4 | ORAOV1 | 0 | 1 | 0 |
| 5 | FGF4 | 22 | 8 | 1 |
| 6 | TMEM16A | 0 | 9 | 2 |
| 7 | FADD | 14 | 4 | 0 |
| 8 | PPFIA1 | 0 | 0 | 1 |
| 9 | CTTN | 0 | 1 | 0 |
| 10 | SHANK2 | 0 | 2 | 1 |
| 11 | DHCR7 | 15 | 4 | 0 |
| 12 | Ref.NAGK | 11 | 4 | 0 |
| 13 | FGF3 | 29 | 9 | 1 |
| 14 | INT2 | 21 | 5 | 3 |
| 15 | D11S2179 | 20 | 5 | 0 |
| 16 | D11S1358 | 0 | 1 | 0 |
| 17 | D11S917 | 0 | 1 | 0 |
| 18 | D11S1887 | 1 | 6 | 3 |
| 19 | D11S901 | 0 | 3 | 1 |
A previous study found that p16 microsatellite markers were positive in 44.4% of Stage 1, 51.9% of Stage 2, and 3.7% of Stage 4 OSCC cases.[22] Positivity for the p16 microsatellite marker at 9p21 was 77.8% in well- differentiated, 22.2% in moderately differentiated, and 0% in poorly differentiated OSCC cases.[23-25] The D9S1747 marker was highlighted as an early prognostic marker for OSCC. However, data on microsatellite alterations at the CCND1 loci on chromosome 11q13 are lacking. In our study, we observed a high positivity rate of 98% for the CCND1[26,27] microsatellite marker in OSCC patients (with complete response at 86% and partial response at 12%).
LOH in the CCND1 region is commonly reported in various cancers, with 88% LOH[28] noted in 150 OSCC-positive cases in this study. This aligns with prior findings of frequent homozygosity on the 11p chromosome in head and neck cancers, suggesting that homozygous deletion may play a significant role in OSCC development. Additionally, a separate analysis found the highest frequency of alteration at the D9S168 marker on the 9p23 locus[29] in young adult OSCC patients, while some research reported a 59% LOH and MSI rate on 9p21. In our work, 3.2% of OSCC samples treated with cisplatin and capecitabine were negative for the CCND1 microsatellite marker, potentially due to genetic alterations at chromosome band 11q13.
CONCLUSION
The findings of this study unequivocally demonstrate that microsatellite alterations, specifically instability or deletion, are prevalent at the CCND1 gene on chromosome 11q13 in OSCC. This indicates a critical role for these alterations in the process of tumor development. Furthermore, they hold significant prognostic value as reliable predictors of a heightened risk of recurrence, assuming our results are validated in a larger cohort of patients. Our findings are consistent with those of the only other study published on allelic losses in OSCC, reinforcing the importance of this research.
Financial support and sponsorship
Nil.
Conflict of interest
There are no conflict of interest.
REFERENCES
1. Xie X, Clausen OPF, Boysen M. Correlation of numerical aberrations of chromosomes X and 11 and poor prognosis in squamous cell carcinomas of the head and neck. Arch Otolaryngol Head Neck Surg 2006;132:511-5. [CrossRef] [PubMed] [Google Scholar]
2. Yamano Y, Uzawa K, Saito K, Nakashima D, Kasamatsu A, Koike H, et al. Identification of cisplatin-resistance related genes in head and neck squamous cell carcinoma. Int J Cancer 2010;126:437-49. [CrossRef] [PubMed] [Google Scholar]
3. Murali A, Sailasree R, Sebastian P, Rejnish Kumar R, Varghese BT, Kannan S. Loss of heterozygosity of D9S162:Molecular predictor for treatment response in oral carcinoma. Oral Oncol 2011;47:571-6. [CrossRef] [PubMed] [Google Scholar]
4. Huang X, Gollin SM, Raja S, Godfrey TE. High-resolution mapping of the 11q13 amplicon and identification of a gene, TAOS1, that is amplified and overexpressed in oral cancer cells. Proc Natl Acad Sci USA 2002;99:11369-74. [CrossRef] [PubMed] [PubMed Central] [Google Scholar]
5. French JD, Ghoussaini M, Edwards SL, Meyer KB, Michailidou K, Ahmed S, Khan S, et al. Functional variants at the 11q13 risk locus for breast cancer regulate cyclin D1 expression through long-range enhancers. Am J Hum Genet 2013;92:489-503. [PubMed] [PubMed Central] [Google Scholar]
6. Noorlag R, van Kempen PM, Stegeman I, Koole R, van Es RJ, Willems SM. The diagnostic value of 11q13 amplification and protein expression in the detection of nodal metastasis from oral squamous cell carcinoma:A systematic review and meta-analysis. Virchows Arch 2015;466:363-73. [CrossRef] [PubMed] [PubMed Central] [Google Scholar]
7. Chien HT, Cheng SD, Liao CT, Wang HM, Huang SF. Amplification of the EGFR and CCND1 are coordinated and play important roles in the progression of oral squamous cell carcinomas. Cancers (Basel) 2019;11:760. [CrossRef] [PubMed] [PubMed Central] [Google Scholar]
8. Ramos-Garcia P, Gil-Montoya JA, Scully C, Ayen A, Gonzalez-Ruiz L, NavarroTrivino F-J, et al. An update on the implications of Cyclin D1 in oral carcinogenesis. Oral Dis 2017;23:897-912. [CrossRef] [PubMed] [Google Scholar]
9. Sabir M, Baig RM, Mahjabeen I, KayaniInt MA. Significance of cyclin D1 polymorphisms in patients with head and neck cancer. J Biol Markers 2013;28:49-55. [CrossRef] [PubMed] [Google Scholar]
10. Akervall J, Kurnit DM, Adams M, Zhu S, Fisher SG, Bradford CR, et al Overexpression of cyclin D1 correlates with sensitivity to cisplatin in squamous cell carcinoma cell lines of the head and neck. Acta Otolaryngol 2004;124:851-7. [CrossRef] [PubMed] [Google Scholar]
11. Akervall J, Guo X, Qian CN, Schoumans J, Leeser B, Kort E, et al.Genetic and expression profiles of squamous cell carcinoma of the head and neck correlate with cisplatin sensitivity and resistance in cell lines and patients. Clin Cancer Res 2004;10:8204-13. [CrossRef] [PubMed] [Google Scholar]
12. Anand U, Dey A, Chandel AKS, Sanyal R, Mishra A, Pandey DK, et al. Cancer chemotherapy and beyond:Current status, drug candidates, associated risks and progress in targeted therapeutics. Genes Dis 2022;10:1367-1401. [CrossRef] [PubMed] [PubMed Central] [Google Scholar]
13. Maria OM, Eliopoulos N, Muanza T. Radiation-induced oral mucositis. Front Oncol 2017;7:89. [CrossRef] [PubMed] [PubMed Central] [Google Scholar]
14. Pulito C, Cristaudo A, Porta CL, Zapperi S, Blandino G, Morrone A, et al. Oral mucositis:The hidden side of cancer therapy. J Exp Clin Cancer Res 2020;39:210. [CrossRef] [PubMed] [PubMed Central] [Google Scholar]
15. Biskup E, Schejbel L, Oliveira DNP, Hogdall E. Test of an improved DNA and RNA purification protocol—importance of proteinase K and co-purified small RNAs. Separations 2022;9:324. [CrossRef] [Google Scholar]
16. Liu AW, Villar-Briones A, Luscombe NM, Plessy C. Automated phenol-chloroform extraction of high molecular weight genomic DNA for use in long-read single-molecule sequencing. F1000Res 2022;11:240. [CrossRef] [PubMed] [PubMed Central] [Google Scholar]
17. Haydar MM, Ramanathan A, Ismail SM, Abraham MT, Jamaluddin M, Zain RB. Cyclin D1 amplification in tongue and cheek squamous cell carcinomas. Asian Pacific J Cancer Prev 2011;12:2199-204. [PubMed] [Google Scholar]
18. Kishikawa T, Suzuki M, Takemoto N, Fukusumi T, Michiba T, Hanamoto A, et al. Response Evaluation Criteria in Solid Tumors (RECIST) and PET Response Criteria in Solid Tumors (PERCIST) for response evaluation of the neck after chemoradiotherapy in head and neck squamous cell carcinoma. Head Neck 2021;43:1184-1193. [CrossRef] [PubMed] [Google Scholar]
19. Babji D, Nayak R, Bhat K, Kotrashetti V, Babaji H, Kugaji MS. Detection and comparison of microsatellite marker D9S1747 with clinical stages and grades of oral squamous cell carcinoma. J Oral Maxillofac Pathol 2019;23:161. [CrossRef] [PubMed] [PubMed Central] [Google Scholar]
20. Sugahara K, Michikawa Y, Ishikawa K, Shoji Y, Iwakawa M, Shibahara T, et al. Combination effects of distinct cores in 11q13 amplification region on cervical lymph node metastasis of oral squamous cell carcinoma, emerging biomarkers in head and neck cancer in the era of genomics. Nat Rev Clin Oncol 2014;12:11e26. [PubMed] [Google Scholar]
21. Akervall J, Kurnit DM, Adams M, Zhu S, Fisher SG, Bradford CR, et al. Overexpression of cyclin D1 correlates with sensitivity to cisplatin in squamous cell carcinoma cell lines of the head and neck. Acta Otolaryngol 2004;124:851-7. [CrossRef] [PubMed] [Google Scholar]
22. Shalini CR, Huang X, Schoppy DW, Black RC, William S, Saunders SW, et al. Relationship between FRA11F and 11q13 gene amplification in oral cancer. Genes Chromosomes Cancer 2007;46:143-54. [CrossRef] [PubMed] [Google Scholar]
23. Josifovski T, Matevska N, Hiljadnikova-Bajro M, Sterjev Z, Kapedanovska A, Serafimoska Z, et al. Cyclin D1 G870A variant is associated with increased risk of microsatellite instability-positive colorectal cancer in young male patients. Balkan J Med Med Genetics 2007;10:29-36. [CrossRef] [Google Scholar]
24. Maity B, Gupta S. Profiling of TOC-microsatellite loci at 17q25 in OSCC patients with therapeutic validation. Int J Pharm Clin Res 2023;15:1535-51. [Google Scholar]
25. Hong Y, Eu KW, Seow-Choen F, Fook-Chong S, Cheah PY. GG genotype of cyclin D1 G870A polymorphism is associated with increased risk and advanced colorectal cancer in patients in Singapore. Eur J Cancer 2005;41:1037-44. [CrossRef] [PubMed] [Google Scholar]
26. Lin SC, Chang MF, Chung MY, Chang CS, Kao SY, Liu CJ, et al. Frequent microsatellite alterations of chromosome locus 4q13.1 in oral squamous cell carcinomas. J Oral Pathol Med 2005;34:209-13. [CrossRef] [PubMed] [Google Scholar]
27. Komatsu Y, Hibi K, Kodera Y, Akiyama S, Ito K, Nakao A, et al.TAOS1, a novel marker for advanced esophageal squamous cell carcinoma. Anticancer Res 2006;26:2029-32. [PubMed] [Google Scholar]
28. Luo ML, Shen XM, Zhang Y, Wei F, Xu X, Cai Y, et al. Amplification and overexpression of CTTN (EMS1) contribute to the metastasis of esophageal squamous cell carcinoma by promoting cell migration and anoikis resistance. Cancer Res 2006;66:11690-9. [CrossRef] [PubMed] [Google Scholar]
29. Peltomaki P, Olkinuora A, Nieminen TT. Updates in the field of hereditary nonpolyposis colorectal cancer. Expert Rev Gastroenterol Hepatol 2020;14:707-20.[CrossRef] [PubMed] [Google Scholar]